‘Retention’ is a measure of how many students return to the college at various points in their careers. It can be a little misleading, however.
We usually measure progress towards graduation in terms of credits–each class carries between 1 and 4 credits, and to graduate, a student needs to complete 120 credits in total. So long as a student is earning a good number of credits per semester (usually 15), they are on track to graduate.
But for retention, we measure the students’ enrollment in time, not in credits. So a student is retained for 1 year if that student continues to be enrolled exactly 1 year after they started, regardless of the number of credits that student has earned. So if a student takes some time off during their undergraduate career, they won’t count as ‘retained’ during their time off. But they will still be making adequate progress to their degree.
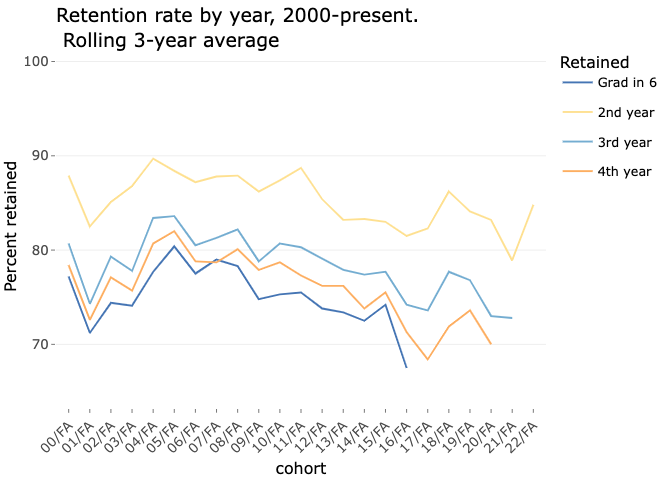
By the way, the weird spot in 2007 when we graduated more students than we retained to the 3rd year is real. In this case, there was a single student who had a leave of absence during their 3rd fall semester, but returned in the Spring and finished their degree 1 year later. Hence, that student graduated 4.5 years after entering, but was not ‘retained’ in the fall of their 3rd year.
| gap | 10/FA | 11/FA | 12/FA | 13/FA | 14/FA | 15/FA | 16/FA | 17/FA | 18/FA | 19/FA | 20/FA | 21/FA | 22/FA |
|---|---|---|---|---|---|---|---|---|---|---|---|---|---|
| 2nd year | 86.7 | 87.8 | 85.1 | 83.0 | 82.9 | 83.0 | 81.5 | 82.1 | 86.0 | 84.1 | 83 | 78.9 | 84.1 |
| 3rd year | 78.9 | 77.6 | 75.2 | 75.7 | 76.1 | 76.9 | 72.2 | 71.5 | 77.7 | 76.4 | 71 | 68.6 | NA |
| 4th year | 77.7 | 76.7 | 75.3 | 75.0 | 73.4 | 74.6 | 70.6 | 67.4 | 71.1 | 71.2 | 67 | NA | NA |
| Grad in 6 | 75.3 | 75.5 | 73.8 | 73.4 | 72.5 | 74.2 | 67.5 | NA | NA | NA | NA | NA | NA |
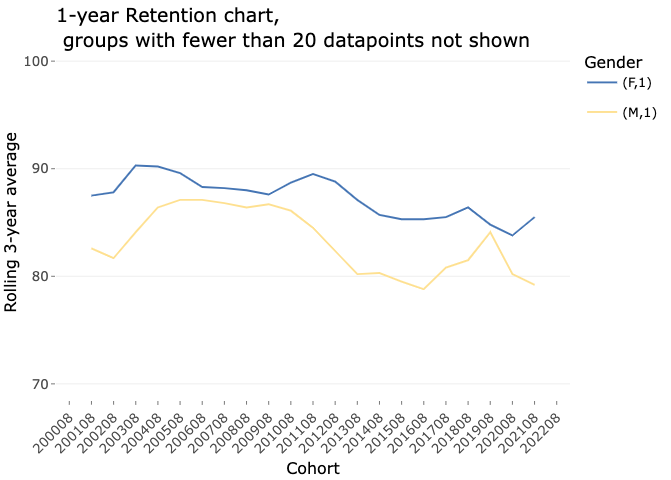
We track retention by a number of demographic variables to help identify and amerliorate any hidden impediments to student success.
Retention By Gender
We are charting only 1-year retention (i.e. returning for the fall semester exactly 1 year after starting), for the sake of clarity. Student gender, like racial and ethnicity data below, originates with the students’ college application–either Allegheny’s or the Common App.
A student can update their demographic information by visiting the Registrar’s office.
Retention rates for entering class starting 2017.
| gap | F | M | O |
|---|---|---|---|
| 2nd year | 87.0 | 80.6 | 50 |
| 3rd year | 80.1 | 71.9 | 50 |
| 4th year | 74.0 | 67.7 | 50 |
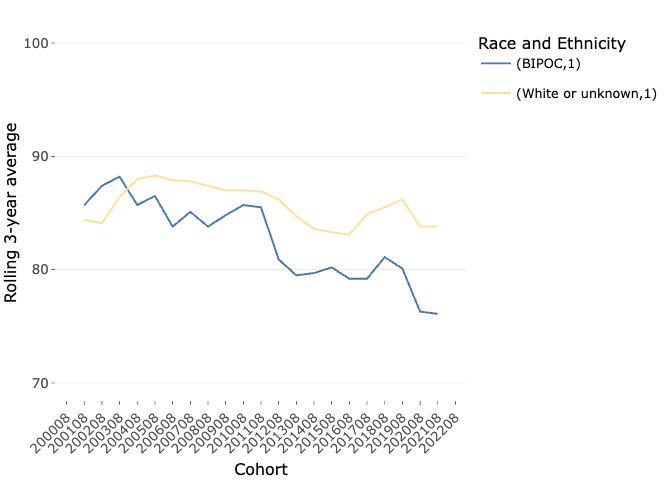
Race and Ethnicity
An individual student’s racial and ethnic identity is a complicated and person matter. Our goal in tracking retention is to discover any factors that may cause a student to leave their college career–and we need to know if there are any racial or cultural factors that are contributing to this.
However, the categories we use for ‘race’ and ‘ethnicity’ are not very sophisticated. Our information about a students’ identity ultimately comes from the boxes that they checked when filling out the college’s application–or the common app.
The boxes that are presented to students in the application derive from the U.S. Department of Education’s definitions, which are used in the Common Data Set completed by most colleges in the U.S. These categories are limited in a number of ways, including classifying all students without U.S. citizenship as a racial / ethnic identity ‘Non-Resident.’ That means international students are not counted in the category of their racial / ethnic identity, regardless of what box they checked in their application process.
To simplify our reporting charts, we are removing all ‘international’ students from the dataset, and combining all non-white, non-unknown students into the albeit awkward category ‘BIPOC’ or ‘Black-Indigenous-People-of-Color’. This is not a great choice, but it is what we’re left with given the paucity of our source data.
Retention rates for entering class starting 2017.
| gap | BIPOC | International | White or unknown |
|---|---|---|---|
| 2nd year | 82.3 | 73.7 | 85.3 |
| 3rd year | 71.8 | 63.2 | 78.8 |
| 4th year | 66.9 | 42.1 | 74.2 |
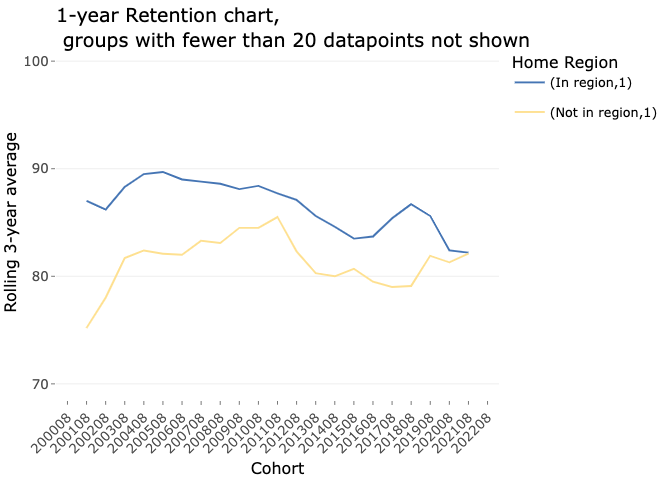
By Permanent Residence – Region
Not surprisingly, distance from home can play a role how long a student stays at a college or university.
Our region is the Western Pennsylvania, New York and Eastern Ohio. Figuring out the parts of the states is difficult, however, so we consider the full states of PA, NY and OH ‘in region.’ Students from other states are ‘Not in region.’
Retention rates for entering class starting 2017.
| gap | In region | Not in region |
|---|---|---|
| 2nd year | 86.4 | 79.2 |
| 3rd year | 77.2 | 74.8 |
| 4th year | 72.1 | 69.2 |
Previous years data available as PDF:
- Fall 2021
- Fall 2020
- Fall 2019
- Fall 2018
- Fall 2017
- Fall 2016
- Fall 2015
- Fall 2014